


Hydroxychloroquine Sulphate
Hydroxychloroquine Sulphate Market 2020 By Product Type (USP Standards Grade, EP Standards Grade, Pharmaceutical Standards Grade, Others), By Disease Indication (Rheumatoid Arthritis, Coronavirus Disease (COVID 19), Adolescent Chronic Joint, Discoid and Systemic Lupus Erythematous, Malaria) Forecast to 2025
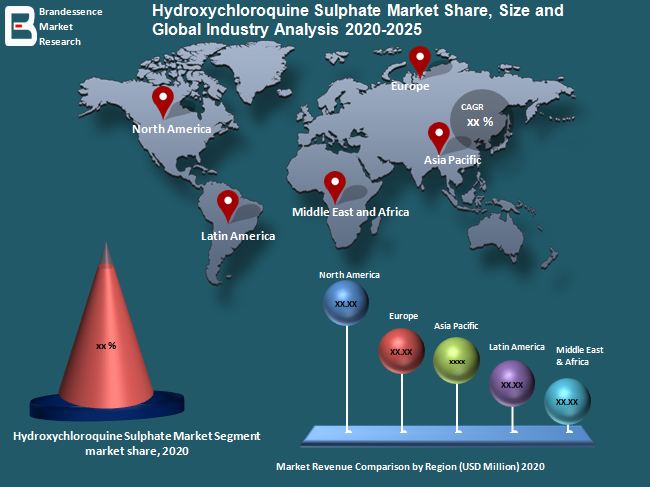
Report ID: BMRC 2820 | Number of pages: 198 | Publish Date: Apr 2020 | Category: Chemicals and MaterialsHydroxychloroquine Sulphate Market is expected to grow with the CAGR of 40.37% over the forecast period.
The Detailed market intelligence report on the Hydroxychloroquine Sulphate Market applies the most effective of each primary and secondary analysis to weighs upon the competitive landscape and also the outstanding market players expected to dominate Hydroxychloroquine Sulphate Market place for the forecast 2019– 2025.
Scope of the Report:
Report evaluates the growth rate and the Market value based on Market dynamics, growth inducing factors. The complete knowledge is based on latest industry news, opportunities and trends. The report contains a comprehensive Market analysis and vendor landscape in addition to a SWOT analysis of the key vendors.
Geographically, this report split global into several key Regions, revenue (Million USD) The geography (North America, Europe, Asia-Pacific, Latin America and Middle East & Africa) focusing on key countries in each region. It also covers market drivers, restraints, opportunities, challenges, and key issues in Hydroxychloroquine Sulphate Market.
Global Hydroxychloroquine Sulphate Market Dynamics–
Rising prevalence of chronic diseases worldwide, growing demand for malaria diagnostics and introduction of novel diagnostics techniques are the key factors driving the growth of the market. Additionally, the tropical disease caused by female Anopheles mosquito, infected by the Plasmodium species caused over 4,35,000 deaths globally in 2017, as stated by the World Health Organization (WHO). Figures from the same source specify that over 219 million cases of malaria were recorded globally, with over 92% cases being reported from Africa, 6% from South East Asia, and 2% from the Eastern Mediterranean regions.
Thus, rising disease prevalence is also anticipated to boost the market growth in future. Also, favorable government policies towards hydroxychloroquine sulfate tablet boost the market demand. However, the drug has some serious side effects such as headache, drowsiness, visual disturbances, cardiovascular collapse which may hinders the market growth.
Hydroxychloroquine Sulphate Market Segmentation:
By Product Type:
USP Standards Grade
EP Standards Grade
Pharmaceutical Standards Grade
OthersBy Disease Indication:
Rheumatoid Arthritis
Coronavirus Disease (COVID 19)
Adolescent Chronic Joint
Discoid and Systemic Lupus Erythematous
MalariaBy Regional & Country Analysis:
North America (US, Canada)
Europe (UK., France, Germany, Italy)
Asia Pacific (China, Japan, India, Southeast Asia)
Latin America (Brazil, Mexico)
Middle East and Africa (GCC, Africa, Rest of Middle East and Africa)
Key Players Hydroxychloroquine Sulphate Market Report-
Global Hydroxychloroquine Sulphate market report covers prominent players like Sanofi, H-QYN, Mylan, TAJ Pharma, MAAN Medex, Cinkate, Concordia Healthcare, Shanghai Zhongxisanwei, Shenhua Pharm, Wuhan Wuyao Pharmaceutial and others..
This comprehensive report will provide:
Enhance your strategic decision making
Assist with your research, presentations and business plans
Show which emerging market opportunities to focus on
Increase your industry knowledge
Keep you up-to-date with crucial market developments
Allow you to develop informed growth strategies
Build your technical insight
Illustrate trends to exploit
Strengthen your analysis of competitors
Provide risk analysis, helping you avoid the pitfalls other companies could make
Ultimately, help you to maximize profitability for your company.Our Market Research Solution Provides You Answer to Below Mentioned Question:
Which are the driving factors responsible for the growth of market?
Which are the roadblock factors of this market?
What are the new opportunities, by which market will grow in coming years?
What are the trends of this market?
Which are main factors responsible for new product launch?
How big is the global & regional market in terms of revenue, sales and production?
How far will the market grow in forecast period in terms of revenue, sales and production?
Which region is dominating the global market and what are the market shares of each region in the overall market in 2017?
How will each segment grow over the forecast period and how much revenue will these segment account for in 2025?
Which region has more opportunities?

Table of Content
1 Study Coverage
  1.1 Hydroxychloroquine Sulphate  Product
  1.2 Key Market Segments in This Study
  1.3 Key Manufacturers Covered
  1.4 Market by Type
  1.5 Market by Application
  1.6 Study Objectives
  1.7 Years Considered

2 Executive Summary
  2.1 Global Hydroxychloroquine Sulphate  Market Size
    2.1.1 Global Hydroxychloroquine Sulphate  Revenue 2014-2025
    2.1.2 Global Hydroxychloroquine Sulphate  Production 2014-2025
  2.2 Hydroxychloroquine Sulphate  Growth Rate (CAGR) 2019-2025
  2.3 Analysis of Competitive Landscape
    2.3.1 Manufacturers Market Concentration Ratio
    2.3.2 Key Hydroxychloroquine Sulphate  Manufacturers
      2.3.2.1 Hydroxychloroquine Sulphate  Manufacturing Base Distribution, Headquarters
      2.3.2.2 Manufacturers Hydroxychloroquine Sulphate  Product Offered
      2.3.2.3 Date of Manufacturers Enter into Hydroxychloroquine Sulphate  Market
  2.4 Key Trends for Hydroxychloroquine Sulphate  Markets & Products

3 Market Size by Manufacturers
  3.1 Hydroxychloroquine Sulphate  Production by Manufacturers
    3.1.1 Hydroxychloroquine Sulphate  Production by Manufacturers
    3.1.2 Hydroxychloroquine Sulphate  Production Market Share by Manufacturers
  3.2 Hydroxychloroquine Sulphate  Revenue by Manufacturers
    3.2.1 Hydroxychloroquine Sulphate  Revenue by Manufacturers (2014-2019)
    3.2.2 Hydroxychloroquine Sulphate  Revenue Share by Manufacturers (2014-2019)
  3.3 Hydroxychloroquine Sulphate  Price by Manufacturers
  3.4 Mergers & Acquisitions, Expansion Plans

4 Hydroxychloroquine Sulphate  Production by Regions
  4.1 Global Hydroxychloroquine Sulphate  Production by Regions
    4.1.1 Global Hydroxychloroquine Sulphate  Production Market Share by Regions
    4.1.2 Global Hydroxychloroquine Sulphate  Revenue Market Share by Regions
  4.2 North America
    4.2.1 North America Hydroxychloroquine Sulphate  Production
    4.2.2 North America Hydroxychloroquine Sulphate  Revenue
    4.2.3 Key Players in North America
    4.2.4 North America Hydroxychloroquine Sulphate  Import & Export
  4.3 Europe
    4.3.1 Europe Hydroxychloroquine Sulphate  Production
    4.3.2 Europe Hydroxychloroquine Sulphate  Revenue
    4.3.3 Key Players in Europe
    4.3.4 Europe Hydroxychloroquine Sulphate  Import & Export
  4.4 China
    4.4.1 China Hydroxychloroquine Sulphate  Production
    4.4.2 China Hydroxychloroquine Sulphate  Revenue
    4.4.3 Key Players in China
    4.4.4 China Hydroxychloroquine Sulphate  Import & Export
  4.5 Japan
    4.5.1 Japan Hydroxychloroquine Sulphate  Production
    4.5.2 Japan Hydroxychloroquine Sulphate  Revenue
    4.5.3 Key Players in Japan
    4.5.4 Japan Hydroxychloroquine Sulphate  Import & Export

5 Hydroxychloroquine Sulphate  Consumption by Regions
  5.1 Global Hydroxychloroquine Sulphate  Consumption by Regions
    5.1.1 Global Hydroxychloroquine Sulphate  Consumption by Regions
    5.1.2 Global Hydroxychloroquine Sulphate  Consumption Market Share by Regions
  5.2 North America
    5.2.1 North America Hydroxychloroquine Sulphate  Consumption by Application
    5.2.2 North America Hydroxychloroquine Sulphate  Consumption by Countries
    5.2.3 United States
    5.2.4 Canada
    5.2.5 Mexico
  5.3 Europe
    5.3.1 Europe Hydroxychloroquine Sulphate  Consumption by Application
    5.3.2 Europe Hydroxychloroquine Sulphate  Consumption by Countries
    5.3.3 Germany
    5.3.4 France
    5.3.5 UK
    5.3.6 Italy
    5.3.7 Russia
  5.4 Asia Pacific
    5.4.1 Asia Pacific Hydroxychloroquine Sulphate  Consumption by Application
    5.4.2 Asia Pacific Hydroxychloroquine Sulphate  Consumption by Regions
    5.4.3 China
    5.4.4 Japan
    5.4.5 South Korea
    5.4.6 India
    5.4.7 Australia
    5.4.8 Indonesia
    5.4.9 Thailand
    5.4.10 Malaysia
    5.4.11 Philippines
    5.4.12 Vietnam
  5.5 Central & South America
    5.5.1 Central & South America Hydroxychloroquine Sulphate  Consumption by Application
    5.5.2 Central & South America Hydroxychloroquine Sulphate  Consumption by Country
    5.5.3 Brazil
  5.6 Middle East and Africa
    5.6.1 Middle East and Africa Hydroxychloroquine Sulphate  Consumption by Application
    5.6.2 Middle East and Africa Hydroxychloroquine Sulphate  Consumption by Countries
    5.6.3 Turkey
    5.6.4 GCC Countries
    5.6.5 Egypt
    5.6.6 South Africa

6 Market Size by Type
  6.1 Global Hydroxychloroquine Sulphate  Production by Type
  6.2 Global Hydroxychloroquine Sulphate  Revenue by Type
  6.3 Hydroxychloroquine Sulphate  Price by Type

7 Market Size by Application
  7.1 Overview
  7.2 Global Hydroxychloroquine Sulphate  Breakdown Dada by Application
    7.2.1 Global Hydroxychloroquine Sulphate  Consumption by Application
    7.2.2 Global Hydroxychloroquine Sulphate  Consumption Market Share by Application (2014-2019)

8 Manufacturers Profiles
9 Production Forecasts
  9.1 Hydroxychloroquine Sulphate  Production and Revenue Forecast
    9.1.1 Global Hydroxychloroquine Sulphate  Production Forecast 2019-2025
    9.1.2 Global Hydroxychloroquine Sulphate  Revenue Forecast 2019-2025
  9.2 Hydroxychloroquine Sulphate  Production and Revenue Forecast by Regions
    9.2.1 Global Hydroxychloroquine Sulphate  Revenue Forecast by Regions
    9.2.2 Global Hydroxychloroquine Sulphate  Production Forecast by Regions
  9.3 Hydroxychloroquine Sulphate  Key Producers Forecast
    9.3.1 North America
    9.3.2 Europe
    9.3.3 China
    9.3.4 Japan
  9.4 Forecast by Type
    9.4.1 Global Hydroxychloroquine Sulphate  Production Forecast by Type
    9.4.2 Global Hydroxychloroquine Sulphate  Revenue Forecast by Type

10 Consumption Forecast
  10.1 Hydroxychloroquine Sulphate  Consumption Forecast by Application
  10.2 Hydroxychloroquine Sulphate  Consumption Forecast by Regions
  10.3 North America Market Consumption Forecast
    10.3.1 North America Hydroxychloroquine Sulphate  Consumption Forecast by Regions 2019-2025
    10.3.2 United States
    10.3.3 Canada
    10.3.4 Mexico
  10.4 Europe Market Consumption Forecast
    10.4.1 Europe Hydroxychloroquine Sulphate  Consumption Forecast by Regions 2019-2025
    10.4.2 Germany
    10.4.3 France
    10.4.4 UK
    10.4.5 Italy
    10.4.6 Russia
  10.5 Asia Pacific Market Consumption Forecast
    10.5.1 Asia Pacific Hydroxychloroquine Sulphate  Consumption Forecast by Regions 2019-2025
    10.5.2 China
    10.5.3 Japan
    10.5.4 South Korea
    10.5.5 India
    10.5.6 Australia
    10.5.7 Indonesia
    10.5.8 Thailand
    10.5.9 Malaysia
    10.5.10 Philippines
    10.5.11 Vietnam
  10.6 Central & South America Market Consumption Forecast
    10.6.1 Central & South America Hydroxychloroquine Sulphate  Consumption Forecast by Regions 2019-2025
    10.6.2 Brazil
  10.7 Middle East and Africa Market Consumption Forecast
    10.7.1 Middle East and Africa Hydroxychloroquine Sulphate  Consumption Forecast by Regions 2019-2025
    10.7.2 Turkey
    10.7.3 GCC Countries
    10.7.4 Egypt
    10.7.5 South Africa

11 Value Chain and Sales Channels Analysis
  11.1 Value Chain Analysis
  11.2 Sales Channels Analysis
    11.2.1 Hydroxychloroquine Sulphate  Sales Channels
    11.2.2 Hydroxychloroquine Sulphate  Distributors
  11.3 Hydroxychloroquine Sulphate  Customers

12 Market Opportunities & Challenges, Risks and Influences Factors Analysis
  12.1 Market Opportunities and Drivers
  12.2 Market Challenges
  12.3 Market Risks/Restraints
  12.4 Porter’s Five Forces Analysis

13 Key Findings in the Global Hydroxychloroquine Sulphate  Study

14 Appendix
  14.1 Research Methodology
    14.1.1 Methodology/Research Approach
      14.1.1.1 Research Programs/Design
      14.1.1.2 Market Size Estimation
      14.1.1.3 Market Breakdown and Data Triangulation
    14.1.2 Data Source
      14.1.2.1 Secondary Sources
      14.1.2.2 Primary Sources
  14.2 Author Details
  14.3 Disclaimer
List of Tables and Figures

  Figure Hydroxychloroquine Sulphate  Product Picture
  Table Hydroxychloroquine Sulphate  Key Market Segments in This Study
  Table Key Manufacturers Hydroxychloroquine Sulphate  Covered in This Study
  Table Global Hydroxychloroquine Sulphate  Market Size Growth Rate by Type 2019-2025 & (Million US$)
  Figure Global Hydroxychloroquine Sulphate  Production Market Share by Type in 2018 & 2025
  Figure Fixed Hydroxychloroquine Sulphate  Product Picture
  Table Major Manufacturers of Fixed Hydroxychloroquine Sulphate
  Figure Hydroxychloroquine Sulphate  Product Picture
  Table Major Manufacturers of Portable Hydroxychloroquine Sulphate
  Table Global Hydroxychloroquine Sulphate  Market Size Growth Rate by Application 2019-2025
  Figure Global Hydroxychloroquine Sulphate  Consumption Market Share by Application in 2018 & 2025
  Figure Hydroxychloroquine Sulphate  Report Years Considered
  Figure Global Hydroxychloroquine Sulphate  Revenue 2014-2025 (Million US$)
  Figure Global Hydroxychloroquine Sulphate  Production 2014-2025
  Table Global Hydroxychloroquine Sulphate  Market Size Growth Rate by Regions 2019-2025 & (Million US$)
  Table Global Manufacturers Market Concentration Ratio
  Table Hydroxychloroquine Sulphate  Manufacturing Base Distribution and Headquarters
  Table Manufacturers Hydroxychloroquine Sulphate  Product Offered
  Table Date of Manufacturers Enter into Hydroxychloroquine Sulphate  Market
  Table Global Hydroxychloroquine Sulphate  Production by Manufacturers (2014-2019)
  Table Global Hydroxychloroquine Sulphate  Production Share by Manufacturers (2014-2019)
  Figure Global Hydroxychloroquine Sulphate  Production Share by Manufacturers in 2018
  Table Hydroxychloroquine Sulphate  Revenue by Manufacturers (2014-2019) (Million US$)
  Table Hydroxychloroquine Sulphate  Revenue Share by Manufacturers (2014-2019)
  Table Hydroxychloroquine Sulphate  Price by Manufacturers 2014-2019
  Table Mergers & Acquisitions, Expansion Plans
  Table Global Hydroxychloroquine Sulphate  Production by Regions 2014-2019
  Table Global Hydroxychloroquine Sulphate  Production Market Share by Regions 2014-2019
  Figure Global Hydroxychloroquine Sulphate  Production Market Share by Regions 2014-2019
  Figure Global Hydroxychloroquine Sulphate  Production Market Share by Regions in 2018
  Table Global Hydroxychloroquine Sulphate  Revenue by Regions 2014-2019 (Million US$)
  Table Global Hydroxychloroquine Sulphate  Revenue Market Share by Regions 2014-2019
  Figure Global Hydroxychloroquine Sulphate  Revenue Market Share by Regions 2014-2019
  Figure Global Hydroxychloroquine Sulphate  Revenue Market Share by Regions in 2018
  Figure North America Hydroxychloroquine Sulphate  Production and Growth Rate 2014-2019
  Figure North America Hydroxychloroquine Sulphate  Revenue and Growth Rate 2014-2019 (Million US$)
  Table North America Hydroxychloroquine Sulphate  Import & Export
  Figure Europe Hydroxychloroquine Sulphate  Production and Growth Rate 2014-2019
  Figure Europe Hydroxychloroquine Sulphate  Revenue and Growth Rate 2014-2019 (Million US$)
  Table Europe Hydroxychloroquine Sulphate  Import & Export
  Figure China Hydroxychloroquine Sulphate  Production and Growth Rate 2014-2019
  Figure China Hydroxychloroquine Sulphate  Revenue and Growth Rate 2014-2019 (Million US$)
  Table China Hydroxychloroquine Sulphate  Import & Export
  Figure Japan Hydroxychloroquine Sulphate  Production and Growth Rate 2014-2019
  Figure Japan Hydroxychloroquine Sulphate  Revenue and Growth Rate 2014-2019 (Million US$)
  Table Japan Hydroxychloroquine Sulphate  Import & Export
  Table Global Hydroxychloroquine Sulphate  Consumption by Regions 2014-2019
  Table Global Hydroxychloroquine Sulphate  Consumption Market Share by Regions 2014-2019
  Figure Global Hydroxychloroquine Sulphate  Consumption Market Share by Regions 2014-2019
  Figure Global Hydroxychloroquine Sulphate  Consumption Market Share by Regions in 2018
  Figure North America Hydroxychloroquine Sulphate  Consumption and Growth Rate (2014-2019)
  Table North America Hydroxychloroquine Sulphate  Consumption by Application (2014-2019)
  Figure 2018 North America Hydroxychloroquine Sulphate  Consumption Market Share by Application
  Table North America Hydroxychloroquine Sulphate  Consumption by Countries (2014-2019)
  Figure 2018 North America Hydroxychloroquine Sulphate  Consumption Market Share by Countries
  Figure United States Hydroxychloroquine Sulphate  Consumption and Growth Rate (2014-2019)
  Figure Canada Hydroxychloroquine Sulphate  Consumption and Growth Rate (2014-2019)
  Figure Mexico Hydroxychloroquine Sulphate  Consumption and Growth Rate (2014-2019)
  Figure Europe Hydroxychloroquine Sulphate  Consumption and Growth Rate (2014-2019)
  Table Europe Hydroxychloroquine Sulphate  Consumption by Application (2014-2019)
  Figure 2018 Europe Hydroxychloroquine Sulphate  Consumption Market Share by Application
  Table Europe Hydroxychloroquine Sulphate  Consumption by Countries (2014-2019)
  Figure 2018 Europe Hydroxychloroquine Sulphate  Consumption Market Share by Countries
  Figure Germany Hydroxychloroquine Sulphate  Consumption and Growth Rate (2014-2019)
  Figure France Hydroxychloroquine Sulphate  Consumption and Growth Rate (2014-2019)
  Figure UK Hydroxychloroquine Sulphate  Consumption and Growth Rate (2014-2019)
  Figure Italy Hydroxychloroquine Sulphate  Consumption and Growth Rate (2014-2019)
  Figure Russia Hydroxychloroquine Sulphate  Consumption and Growth Rate (2014-2019)
  Figure Asia Pacific Hydroxychloroquine Sulphate  Consumption and Growth Rate
  Table Asia Pacific Hydroxychloroquine Sulphate  Consumption by Application (2014-2019)
  Table Asia Pacific Hydroxychloroquine Sulphate  Consumption Market Share by Application (2014-2019)
  Table Asia Pacific Hydroxychloroquine Sulphate  Consumption by Regions (2014-2019)
  Table Asia Pacific Hydroxychloroquine Sulphate  Consumption Market Share by Countries (2014-2019)
  Figure China Hydroxychloroquine Sulphate  Consumption and Growth Rate (2014-2019)
  Figure Japan Hydroxychloroquine Sulphate  Consumption and Growth Rate (2014-2019)
  Figure South Korea Hydroxychloroquine Sulphate  Consumption and Growth Rate (2014-2019)
  Figure India Hydroxychloroquine Sulphate  Consumption and Growth Rate (2014-2019)
  Figure Australia Hydroxychloroquine Sulphate  Consumption and Growth Rate (2014-2019)
  Figure Indonesia Hydroxychloroquine Sulphate  Consumption and Growth Rate (2014-2019)
  Figure Thailand Hydroxychloroquine Sulphate  Consumption and Growth Rate (2014-2019)
  Figure Malaysia Hydroxychloroquine Sulphate  Consumption and Growth Rate (2014-2019)
  Figure Philippines Hydroxychloroquine Sulphate  Consumption and Growth Rate (2014-2019)
  Figure Vietnam Hydroxychloroquine Sulphate  Consumption and Growth Rate (2014-2019)
  Figure Central & South America Hydroxychloroquine Sulphate  Consumption and Growth Rate
  Table Central & South America Hydroxychloroquine Sulphate  Consumption by Application (2014-2019)
  Figure 2018 Central & South America Hydroxychloroquine Sulphate  Consumption Market Share by Application
  Table Central & South America Hydroxychloroquine Sulphate  Consumption by Countries (2014-2019)
  Figure Central & South America Hydroxychloroquine Sulphate  Consumption Market Share by Countries
  Figure Brazil Hydroxychloroquine Sulphate  Consumption and Growth Rate (2014-2019)
  Figure Middle East and Africa Hydroxychloroquine Sulphate  Consumption and Growth Rate
  Table Middle East and Africa Hydroxychloroquine Sulphate  Consumption by Application (2014-2019)
  Figure 2018 Middle East and Africa Hydroxychloroquine Sulphate  Consumption Market Share by Application
  Table Middle East and Africa Hydroxychloroquine Sulphate  Consumption by Countries (2014-2019)
  Figure Middle East and Africa Hydroxychloroquine Sulphate  Consumption Market Share by Countries
  Figure Turkey Hydroxychloroquine Sulphate  Consumption and Growth Rate (2014-2019)
  Figure GCC Countries Hydroxychloroquine Sulphate  Consumption and Growth Rate (2014-2019)
  Figure Egypt Hydroxychloroquine Sulphate  Consumption and Growth Rate (2014-2019)
  Figure South Africa Hydroxychloroquine Sulphate  Consumption and Growth Rate (2014-2019)
  Table Global Hydroxychloroquine Sulphate  Production by Type (2014-2019)
  Table Global Hydroxychloroquine Sulphate  Production Share by Type (2014-2019)
  Figure Global Hydroxychloroquine Sulphate  Production Market Share by Type (2014-2019)
  Figure Global Hydroxychloroquine Sulphate  Production Market Share by Type in 2018
  Table Global Hydroxychloroquine Sulphate  Revenue by Type (2014-2019) (Million US$)
  Table Global Hydroxychloroquine Sulphate  Revenue Share by Type (2014-2019)
  Figure Global Hydroxychloroquine Sulphate  Revenue Market Share by Type (2014-2019)
  Figure Global Hydroxychloroquine Sulphate  Revenue Market Share by Type in 2018
  Table Hydroxychloroquine Sulphate  Price by Type 2014-2019
  Table Global Hydroxychloroquine Sulphate  Consumption by Application (2014-2019)
  Table Global Hydroxychloroquine Sulphate  Consumption by Application (2014-2019)
  Table Global Hydroxychloroquine Sulphate  Consumption Share by Application (2014-2019)
  Figure Global Hydroxychloroquine Sulphate  Consumption Market Share by Application (2014-2019)
  Figure Global Hydroxychloroquine Sulphate  Production Forecast 2019-2025
  Figure Global Hydroxychloroquine Sulphate  Revenue Forecast 2019-2025 (Million US$)
  Table Global Hydroxychloroquine Sulphate  Revenue Forecast 2019-2025 (Million US$)
  Table Global Hydroxychloroquine Sulphate  Revenue Forecast by Regions 2019-2025 (Million US$)
  Figure Global Hydroxychloroquine Sulphate  Revenue Forecast by Regions 2019-2025 (Million US$)
  Figure Global Hydroxychloroquine Sulphate  Revenue Market Share Forecast by Regions 2019-2025
  Table Global Hydroxychloroquine Sulphate  Production Forecast by Regions 2019-2025
  Figure Global Hydroxychloroquine Sulphate  Production Forecast by Regions 2019-2025
  Figure Global Hydroxychloroquine Sulphate  Production Market Share Forecast by Regions 2019-2025
  Figure North America Hydroxychloroquine Sulphate  Production Forecast 2019-2025
  Figure North America Hydroxychloroquine Sulphate  Revenue Forecast 2019-2025 (Million US$)
  Figure Europe Hydroxychloroquine Sulphate  Production Forecast 2019-2025
  Figure Europe Hydroxychloroquine Sulphate  Revenue Forecast 2019-2025 (Million US$)
  Figure China Hydroxychloroquine Sulphate  Production Forecast 2019-2025
  Figure China Hydroxychloroquine Sulphate  Revenue Forecast 2019-2025 (Million US$)
  Figure Japan Hydroxychloroquine Sulphate  Production Forecast 2019-2025
  Figure Japan Hydroxychloroquine Sulphate  Revenue Forecast 2019-2025 (Million US$)
  Table Global Hydroxychloroquine Sulphate  Production Forecast by Type 2019-2025
  Figure Global Hydroxychloroquine Sulphate  Production Forecast by Type 2019-2025
  Figure Global Hydroxychloroquine Sulphate  Production Market Share Forecast by Type 2019-2025
  Table Global Hydroxychloroquine Sulphate  Revenue Forecast by Type 2019-2025 (Million US$)
  Figure Global Hydroxychloroquine Sulphate  Revenue Forecast by Type 2019-2025 (Million US$)
  Figure Global Hydroxychloroquine Sulphate  Revenue Market Share Forecast by Type 2019-2025
  Table Global Hydroxychloroquine Sulphate  Consumption Forecast by Application 2019-2025
  Figure Global Hydroxychloroquine Sulphate  Consumption Forecast by Application 2019-2025
  Figure Global Hydroxychloroquine Sulphate  Consumption Market Share Forecast by Application 2019-2025
  Table Global Hydroxychloroquine Sulphate  Consumption Forecast by Regions 2019-2025
  Figure Global Hydroxychloroquine Sulphate  Consumption Forecast by Regions 2019-2025
  Figure Global Hydroxychloroquine Sulphate  Consumption Market Share Forecast by Regions 2019-2025
  Table North America Hydroxychloroquine Sulphate  Consumption Forecast by Regions 2019-2025
  Figure North America Hydroxychloroquine Sulphate  Consumption Forecast 2019-2025
  Figure United States Hydroxychloroquine Sulphate  Consumption Forecast 2019-2025
  Figure Canada Hydroxychloroquine Sulphate  Consumption Forecast 2019-2025
  Figure Mexico Hydroxychloroquine Sulphate  Consumption Forecast 2019-2025
  Table Europe Hydroxychloroquine Sulphate  Consumption Forecast by Regions 2019-2025
  Figure Europe Hydroxychloroquine Sulphate  Consumption Forecast 2019-2025
  Figure Germany Hydroxychloroquine Sulphate  Consumption Forecast 2019-2025
  Figure France Hydroxychloroquine Sulphate  Consumption Forecast 2019-2025
  Figure UK Hydroxychloroquine Sulphate  Consumption Forecast 2019-2025
  Figure Italy Hydroxychloroquine Sulphate  Consumption Forecast 2019-2025
  Figure Russia Hydroxychloroquine Sulphate  Consumption Forecast 2019-2025
  Table Asia Pacific Hydroxychloroquine Sulphate  Consumption Forecast by Regions 2019-2025
  Figure Asia Pacific Hydroxychloroquine Sulphate  Consumption Forecast 2019-2025
  Figure China Hydroxychloroquine Sulphate  Consumption Forecast 2019-2025
  Figure Japan Hydroxychloroquine Sulphate  Consumption Forecast 2019-2025
  Figure South Korea Hydroxychloroquine Sulphate  Consumption Forecast 2019-2025
  Figure India Hydroxychloroquine Sulphate  Consumption Forecast 2019-2025
  Figure Australia Hydroxychloroquine Sulphate  Consumption Forecast 2019-2025
  Figure Indonesia Hydroxychloroquine Sulphate  Consumption Forecast 2019-2025
  Figure Thailand Hydroxychloroquine Sulphate  Consumption Forecast 2019-2025
  Figure Malaysia Hydroxychloroquine Sulphate  Consumption Forecast 2019-2025
  Figure Philippines Hydroxychloroquine Sulphate  Consumption Forecast 2019-2025
  Figure Vietnam Hydroxychloroquine Sulphate  Consumption Forecast 2019-2025
  Table Central & South America Hydroxychloroquine Sulphate  Consumption Forecast by Regions 2019-2025
  Figure Central & South America Hydroxychloroquine Sulphate  Consumption Forecast 2019-2025
  Figure Brazil Hydroxychloroquine Sulphate  Consumption Forecast 2019-2025
  Table Middle East and Africa Hydroxychloroquine Sulphate  Consumption Forecast by Regions 2019-2025
  Figure Middle East and Africa Hydroxychloroquine Sulphate  Consumption Forecast 2019-2025
  Figure Turkey Hydroxychloroquine Sulphate  Consumption Forecast 2019-2025
  Figure GCC Countries Hydroxychloroquine Sulphate  Consumption Forecast 2019-2025
  Figure Egypt Hydroxychloroquine Sulphate  Consumption Forecast 2019-2025
  Figure South Africa Hydroxychloroquine Sulphate  Consumption Forecast 2019-2025
  Figure Hydroxychloroquine Sulphate  Value Chain
  Table Hydroxychloroquine Sulphate  Distributors List
  Table Hydroxychloroquine Sulphate  Customers List
  Table Research Programs/Design for This Report
  Figure Bottom-up and Top-down Approaches for This Report
  Figure Data Triangulation
  Table Key Data Information from Secondary Sources
  Table Key Data Information from Primary Sources